
Call Analysis Graphs in Calley: Understanding Reports for Better Outreach
Call Analysis Graphs in Calley: Understanding Reports for Better Outreach
In Calley, Call Analysis is the process of understanding the outcome and effectiveness of calls made through the platform. It helps admins and managers gain insight into agent performance, lead engagement, and the overall efficiency of calling campaigns. This analysis is done through a set of visual and data-driven reports that track call feedback, agent activity, and campaign performance.
Calley supports three subscription types — Calley Personal, Calley Pro, and Calley Teams — and the level of call analysis available depends on the subscription tier:
Call Analysis in Calley is done through three key parameters:
- ✓Call List – Analyses calls based on the uploaded call list.
- ✓Feedback – Analyses the types of responses received on calls.
- ✓Team Agents – Analyses performance across different agents (available only for Calley Teams).
- 1.Call Analysis Graphs in Calley: Understanding Reports for Better Outreach
- 1.1.Parameter 1: Call List – Analyzing Activity from the Uploaded List
- 1.1.1.How It Analyses Calls:
- 1.1.2.Why This Helps Your Business
- 1.1.3.How to Access This Report
- 1.1.4.Personal:
- 1.1.5.Pro:
- 1.1.6.Teams:
- 1.2.Parameter 2: Feedback – Analyzing the Types of Responses Received on Calls
- 1.2.1.How It Analyses Calls:
- 1.2.2.Why This Helps Your Business
- 1.2.3.How to Access This Report
- 1.2.4.Pro:
- 1.2.5.Teams:
- 1.3.Parameter 3: Team Agents – Analyzing Performance Across Different Agents
- 1.3.1.How It Analyzes Team Performance
- 1.3.2.Why This Helps Your Business
- 1.3.3.How to Access This Report:
- 2.WE KNOW YOU WILL HAVE QUESTIONS.
Parameter 1: Call List – Analyzing Activity from the Uploaded List
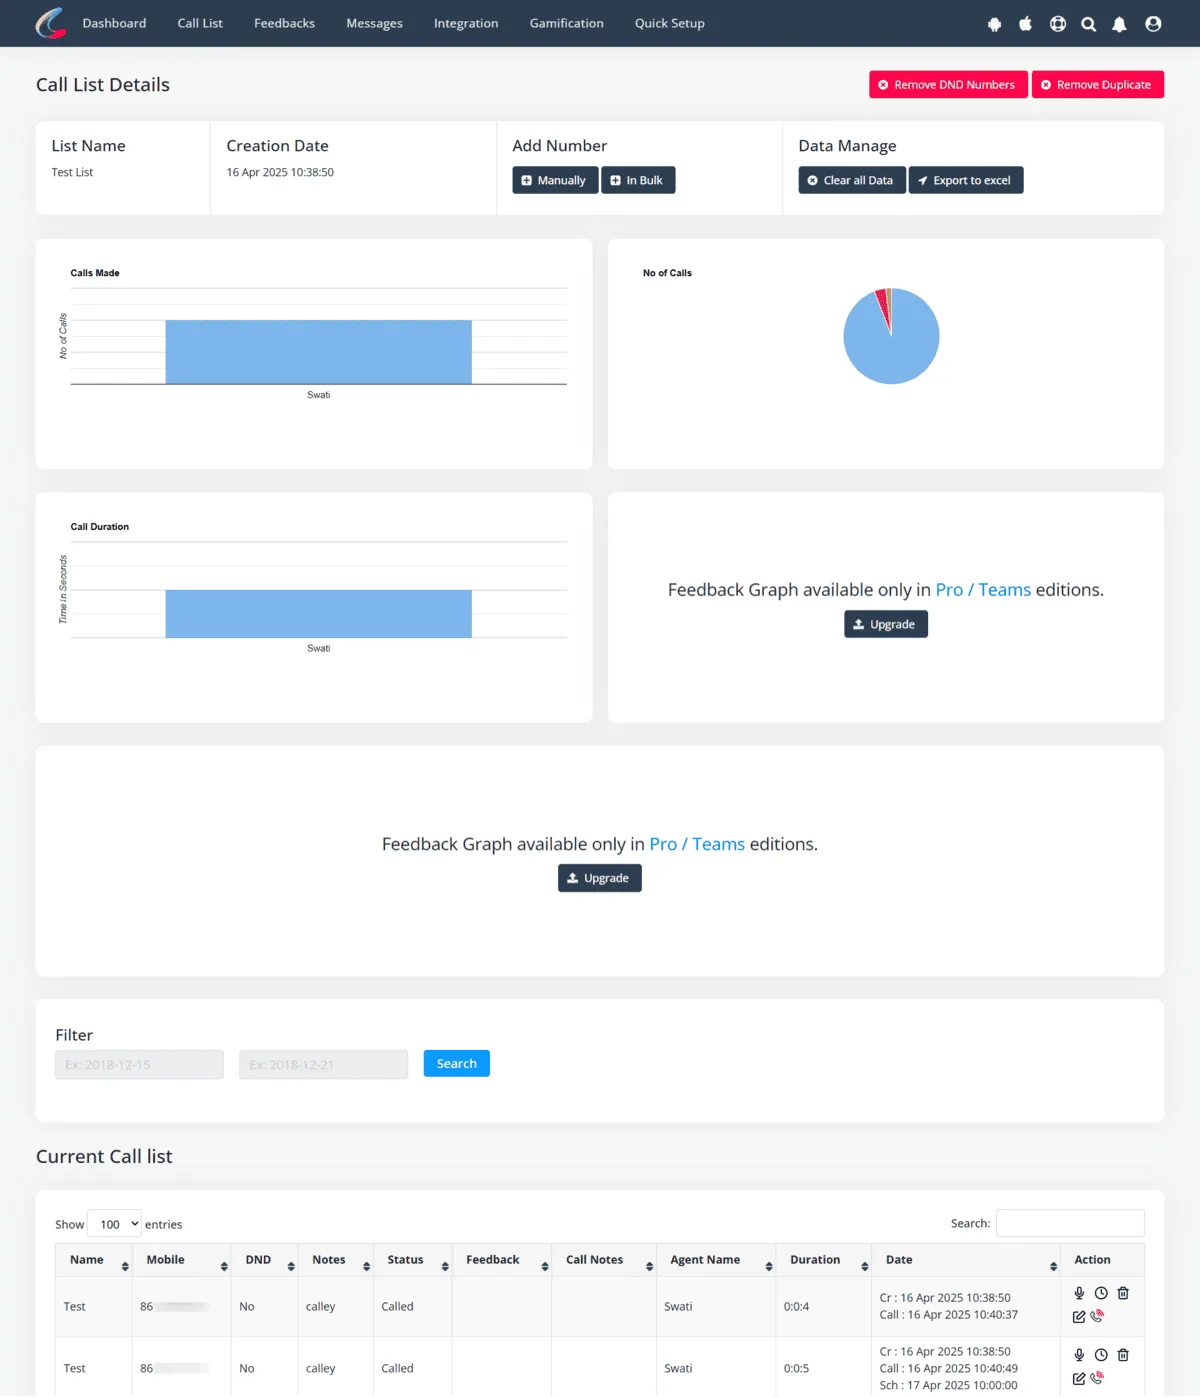
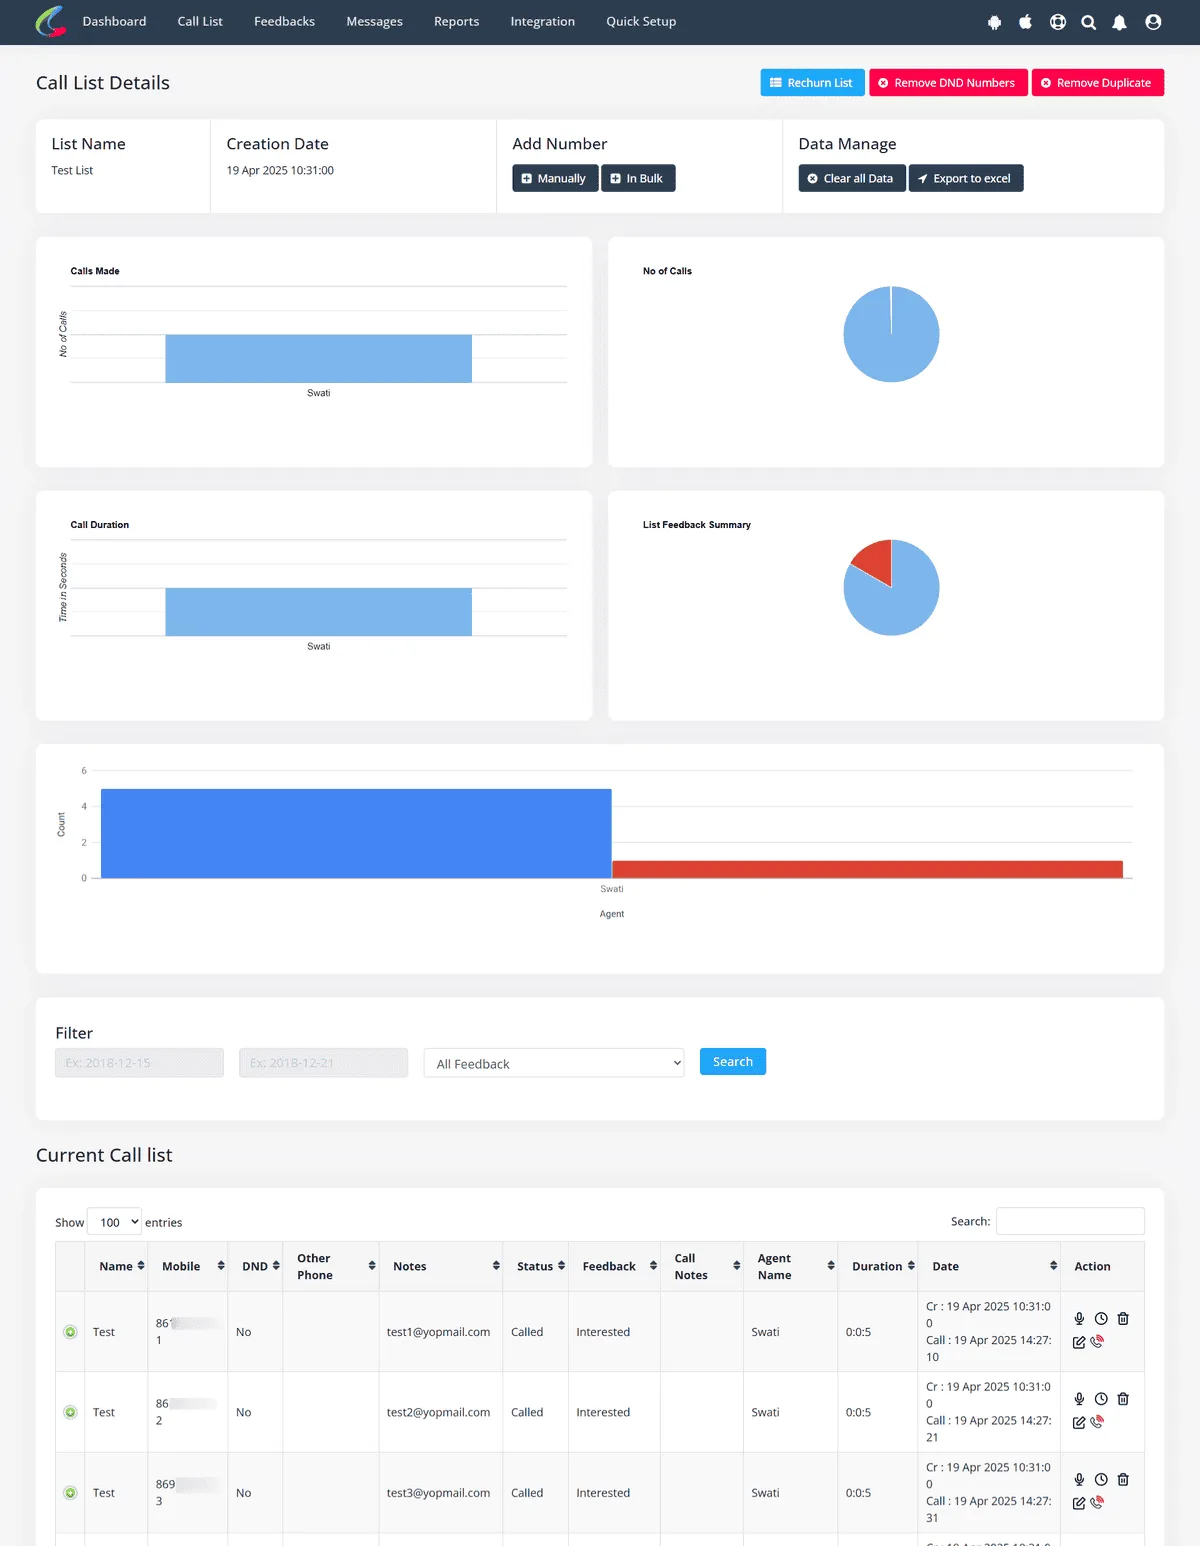
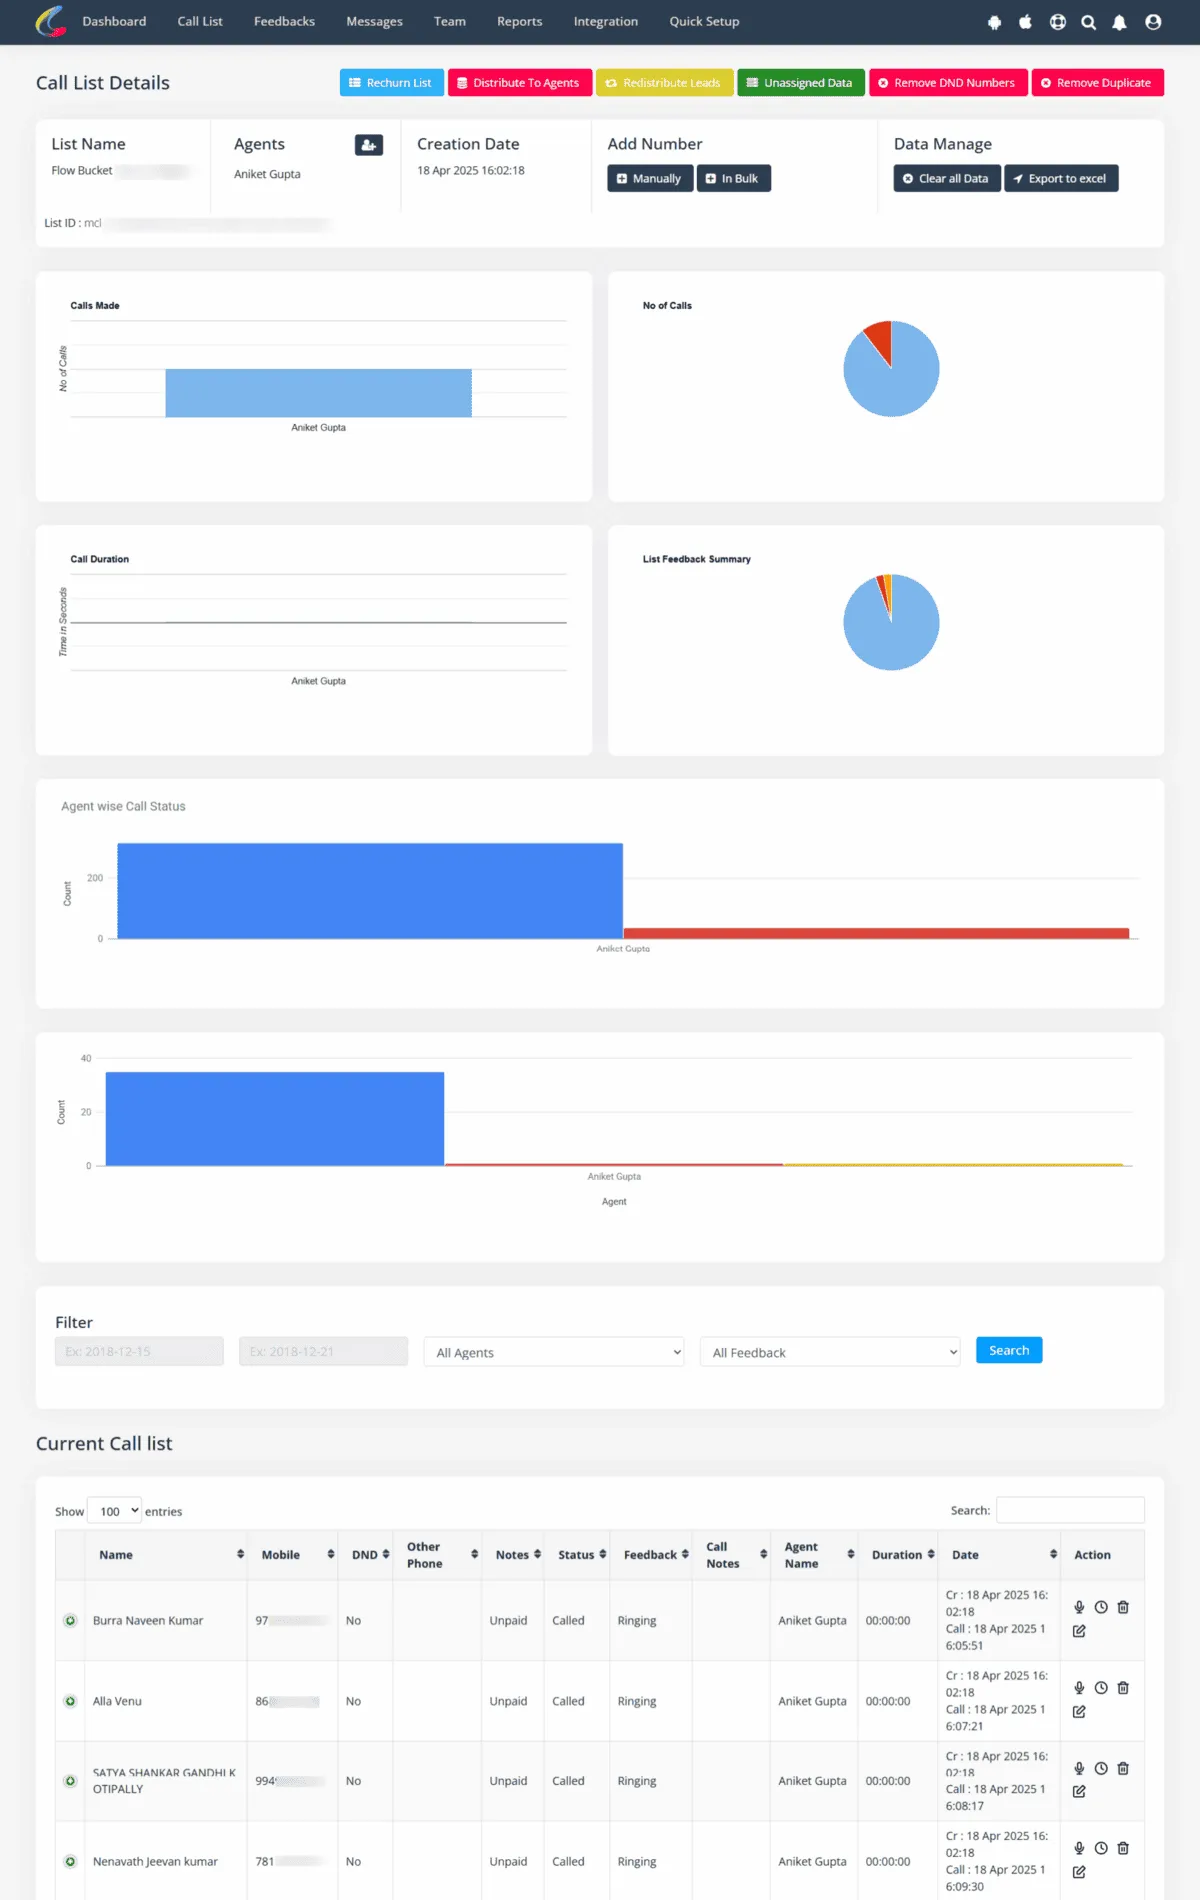
The Call List Details Report is the central place to monitor performance and outcomes for any uploaded list of leads in Calley. It transforms raw call data into clear, visual insights that help users — whether individuals or teams — understand call progress, outcomes, and agent performance (if applicable).
You’ll see:
- ✓Feedback-based graphs for quick visual insights
- ✓List-wise or agent-wise filters for focused analysis
- ✓Detailed table of call records including:
- Feedback type
- Feedback notes
- Call date and time
- Duration
- Scheduled call info
How It Analyses Calls:
- ✓Breaks down call outcomes based on feedback types (e.g., Lead, Not Interested).
- ✓Shows feedback distribution across agents or call lists.
- ✓Visualizes the number of feedbacks received in easy-to-read bar graphs.
- ✓Helps track follow-ups or conversions from specific feedback categories.
- ✓Lets you export detailed call records in Excel or CSV formats for further analysis.
Why This Helps Your Business
The Call List report isn’t just a visual dashboard — it’s a decision-making tool. Here’s how it benefits your business:
- ✓Optimize Outreach Efforts – Know which lists are performing and which need reworking or fresh leads.
- ✓Improve Team Performance – For Teams users, see which agents are hitting targets and who may need coaching.
- ✓Learn from Lead Behavior – Feedback trends (e.g., “Not Interested” vs “Interested”) can guide product, pitch, or timing strategy.
- ✓Adjust Strategy on the Fly – Spot early patterns — e.g., low answer rate — and act immediately (change list, reassign, or pause).
- ✓Exportable Reports – Managers can download Excel summaries for sharing or deeper analysis.
How to Access This Report
- ✓Login to Calley Web Panel
- ✓Navigate to Call List from the top menu, Click on Manage Existing List.
- ✓Click on any list name you’ve uploaded
- ✓You’ll be redirected to the Call List Details Report screen
Personal:
Pro:
Teams:
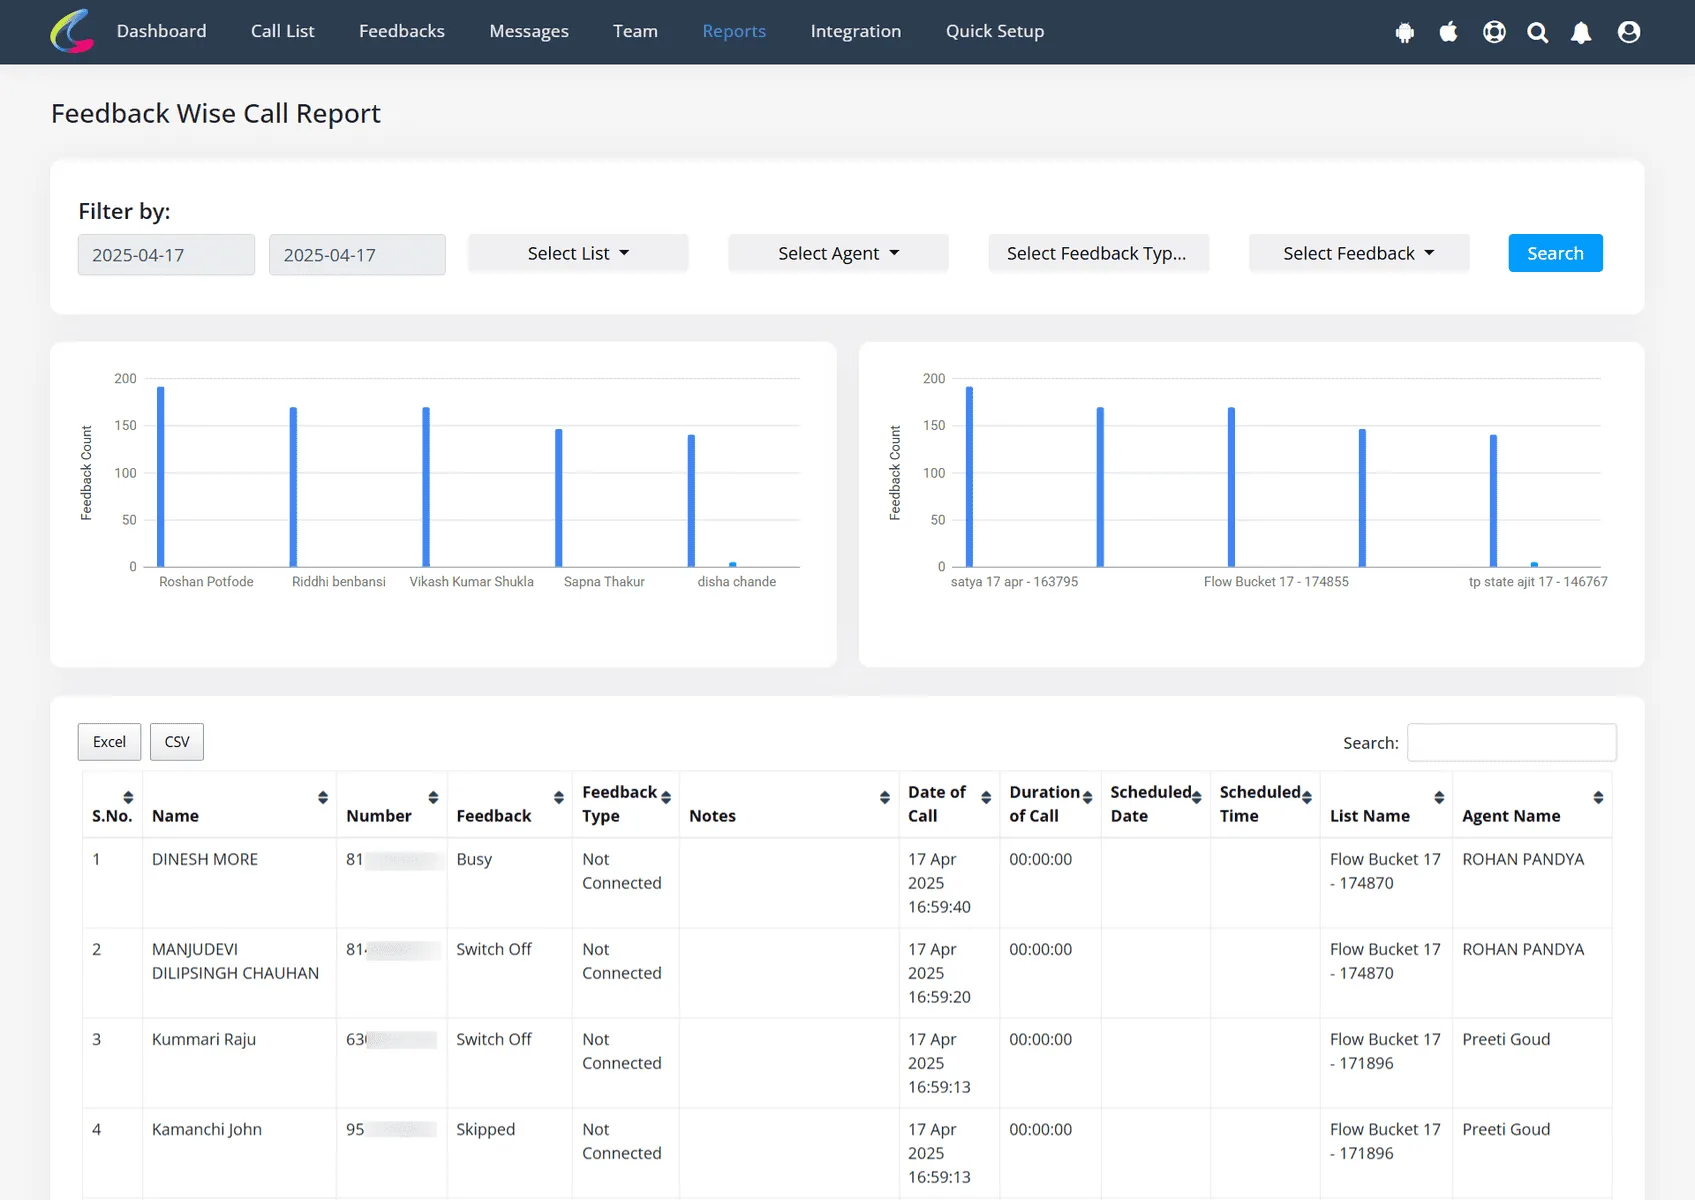
Parameter 2: Feedback – Analyzing the Types of Responses Received on Calls
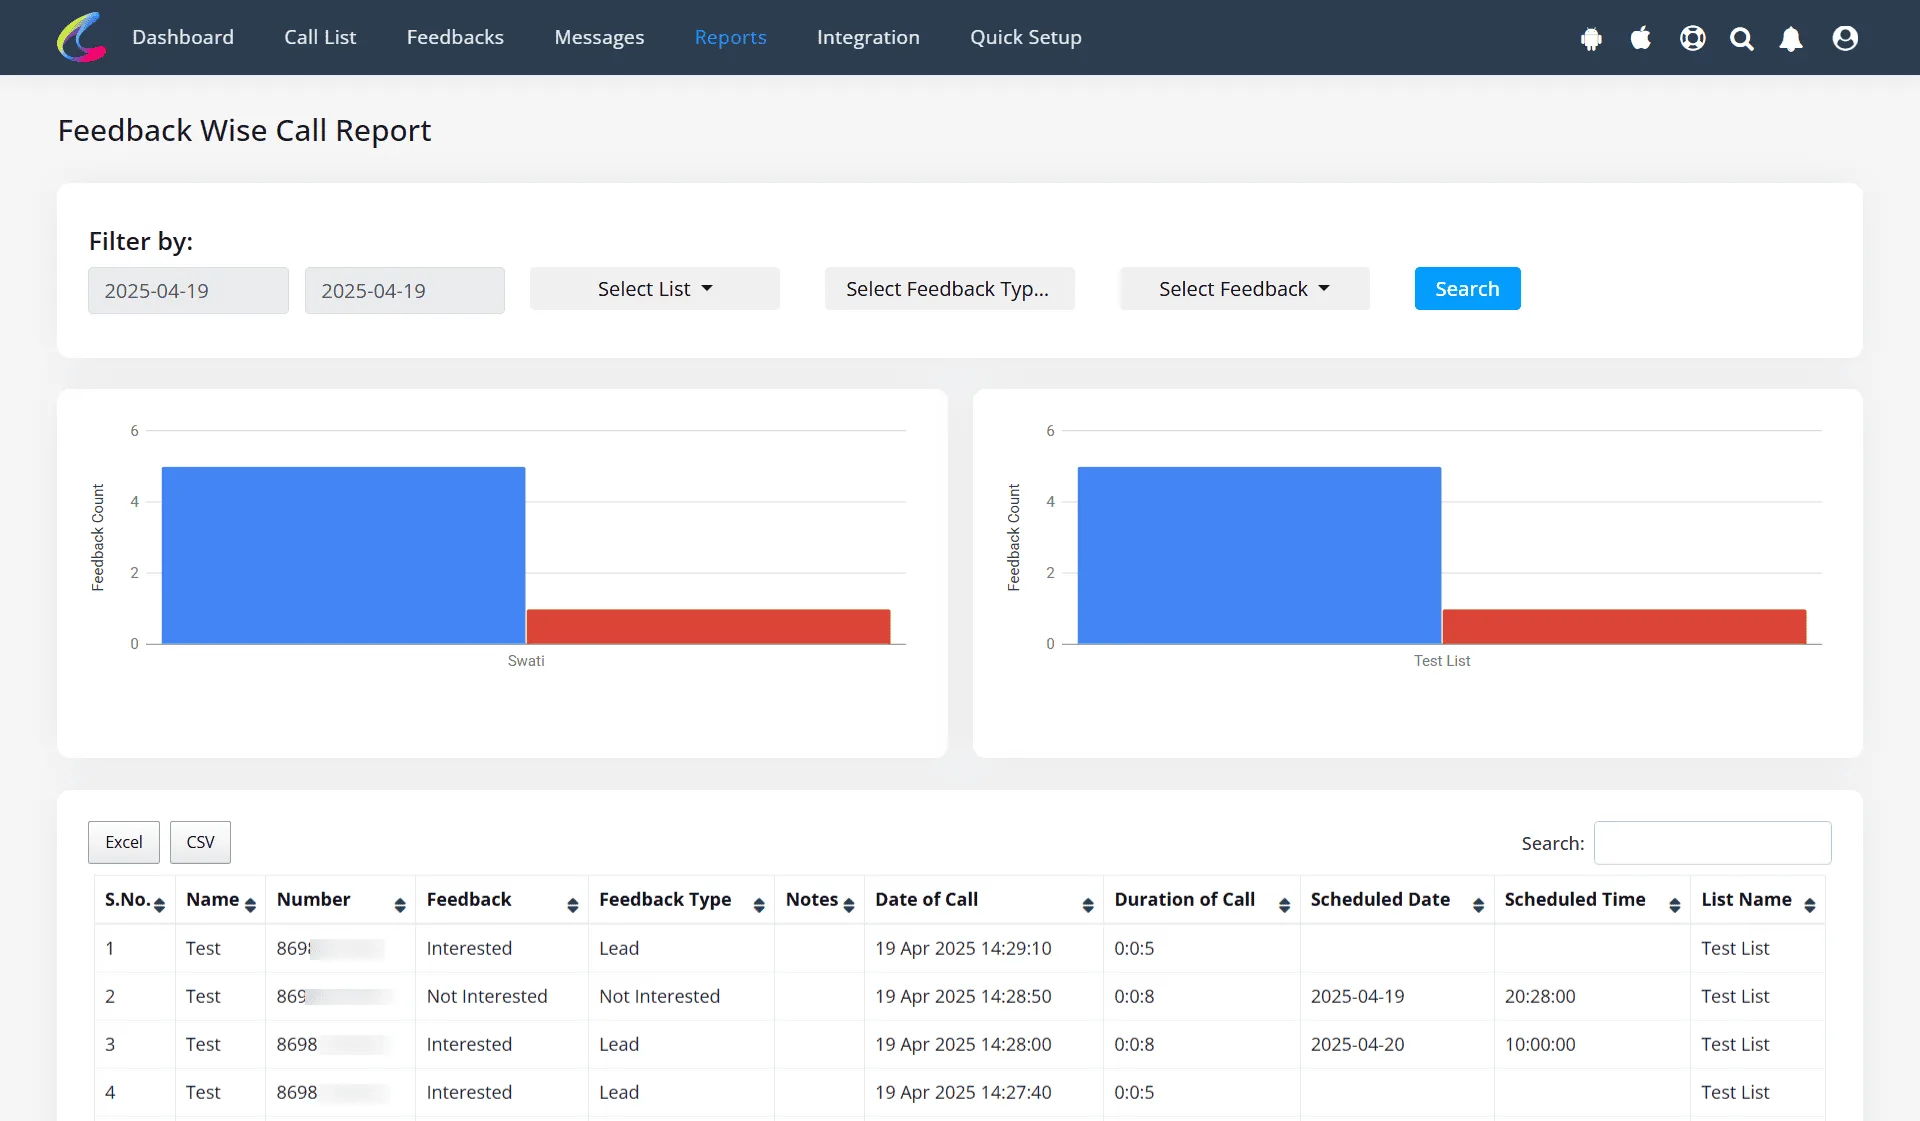
This report helps you understand individual agent performance through call statistics and feedback results. It’s ideal for team leaders or managers who want a clear picture of how their calling team is performing.
You’ll see:
Two main graphs:
- ✓Agent-wise Call Status: Total calls made by each agent.
- ✓Agent-wise Feedback: Types of feedback received per agent.
Detailed metrics like:
- ✓Total calls done
- ✓Duration of calls
- ✓Connected/Not Connected stats
- ✓Skipped or Not Interested breakdown
How It Analyses Calls:
- ✓Counts the total number of feedback entries provided for each agent or list.
- ✓Categorizes feedback based on type (e.g., Lead, Not Interested).
- ✓Visualizes feedback trends across different lists and agents.
- ✓Helps identify high-performing lists and agents based on positive feedback.
- ✓Allows filtering based on date, list, feedback type, and specific feedback for refined analysis.
Why This Helps Your Business
- ✓Evaluate Lead Quality – Identify which lead lists or sources are driving more “Interested” responses, and eliminate underperforming ones.
- ✓Refine Your Approach – High levels of “Not Interested” might signal the need to revise pitch timing or script.
- ✓Track Agent Effectiveness (Teams) – Agent-wise breakdown reveals who is handling conversations more successfully.
- ✓Compare Campaigns Easily – See how different call lists or timeframes perform with simple filters and visual feedback graphs.
- ✓Data-Driven Decisions – Make informed decisions quickly with exportable data and visual clarity.
How to Access This Report
- ✓Login to your Calley Web Panel.
- ✓Navigate to the Reports and Click on Feedback Wise Call Report
- ✓Use the available filters to customize your view by date, list, feedback type, or agent. Scroll down to view visual graphs and the detailed feedback table.
Pro:
Teams:
Parameter 3: Team Agents – Analyzing Performance Across Different Agents
(Available only for Calley Teams)
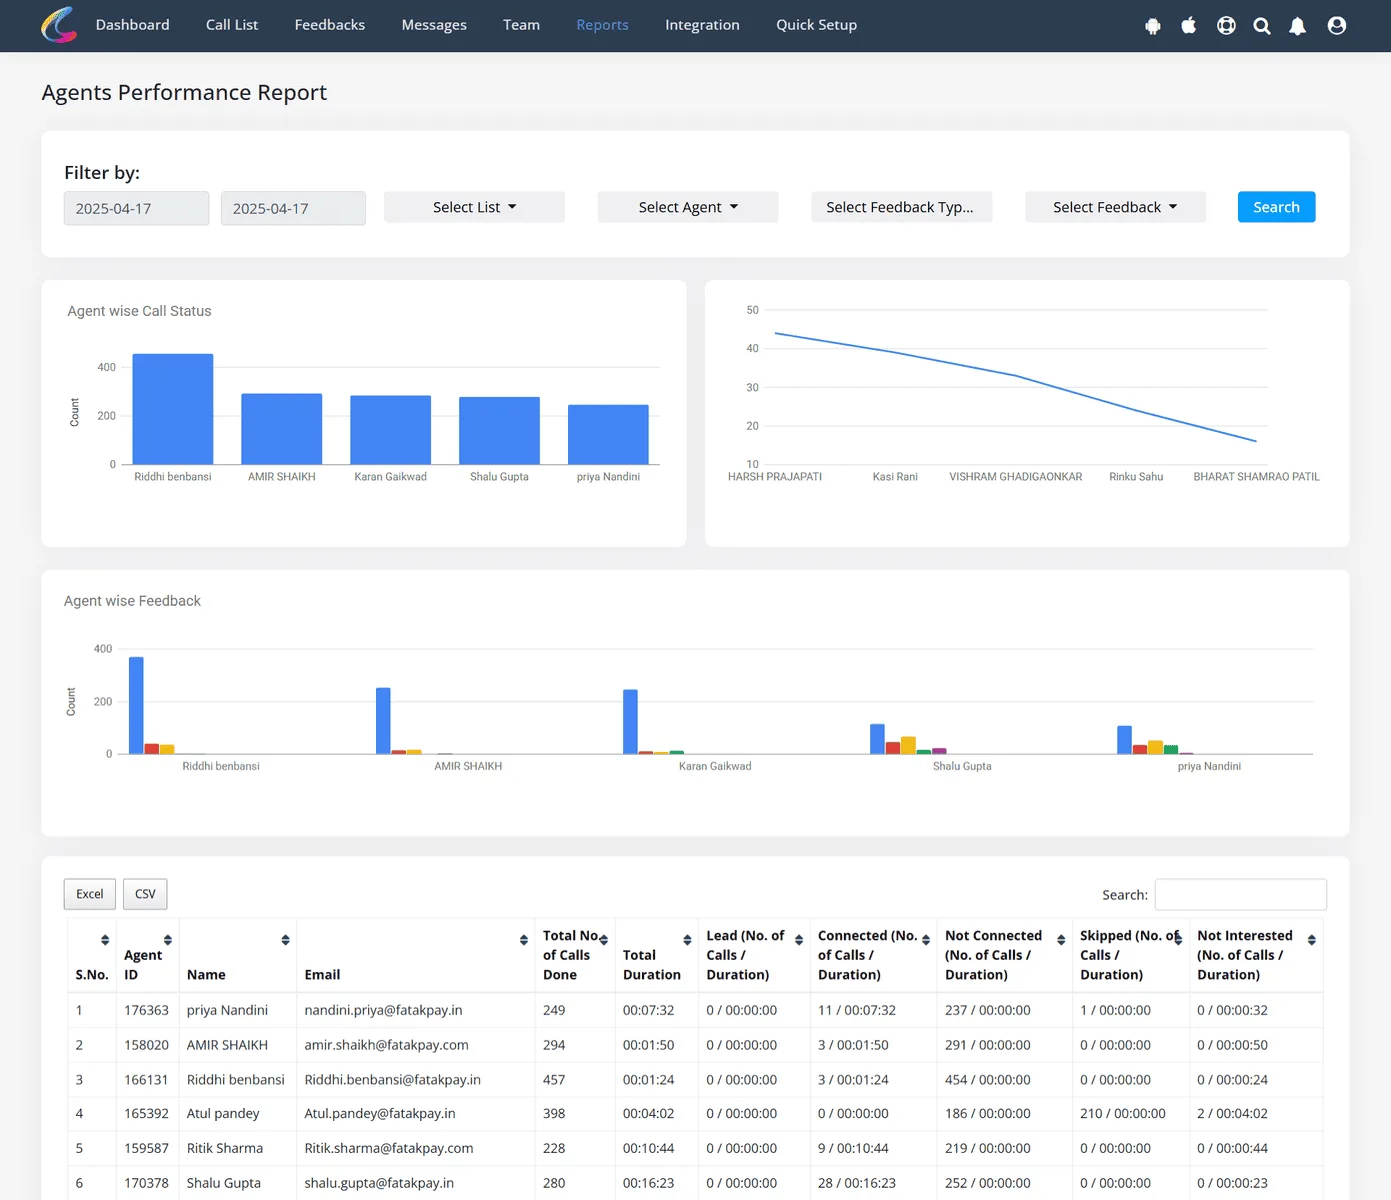
This section gives a comprehensive overview of how each team member is performing on their calls. It offers two powerful graphical tools to analyze agent-level data:
- ✓Agent Performance Graph – Shows metrics like total calls made, feedback received, and call status per agent.
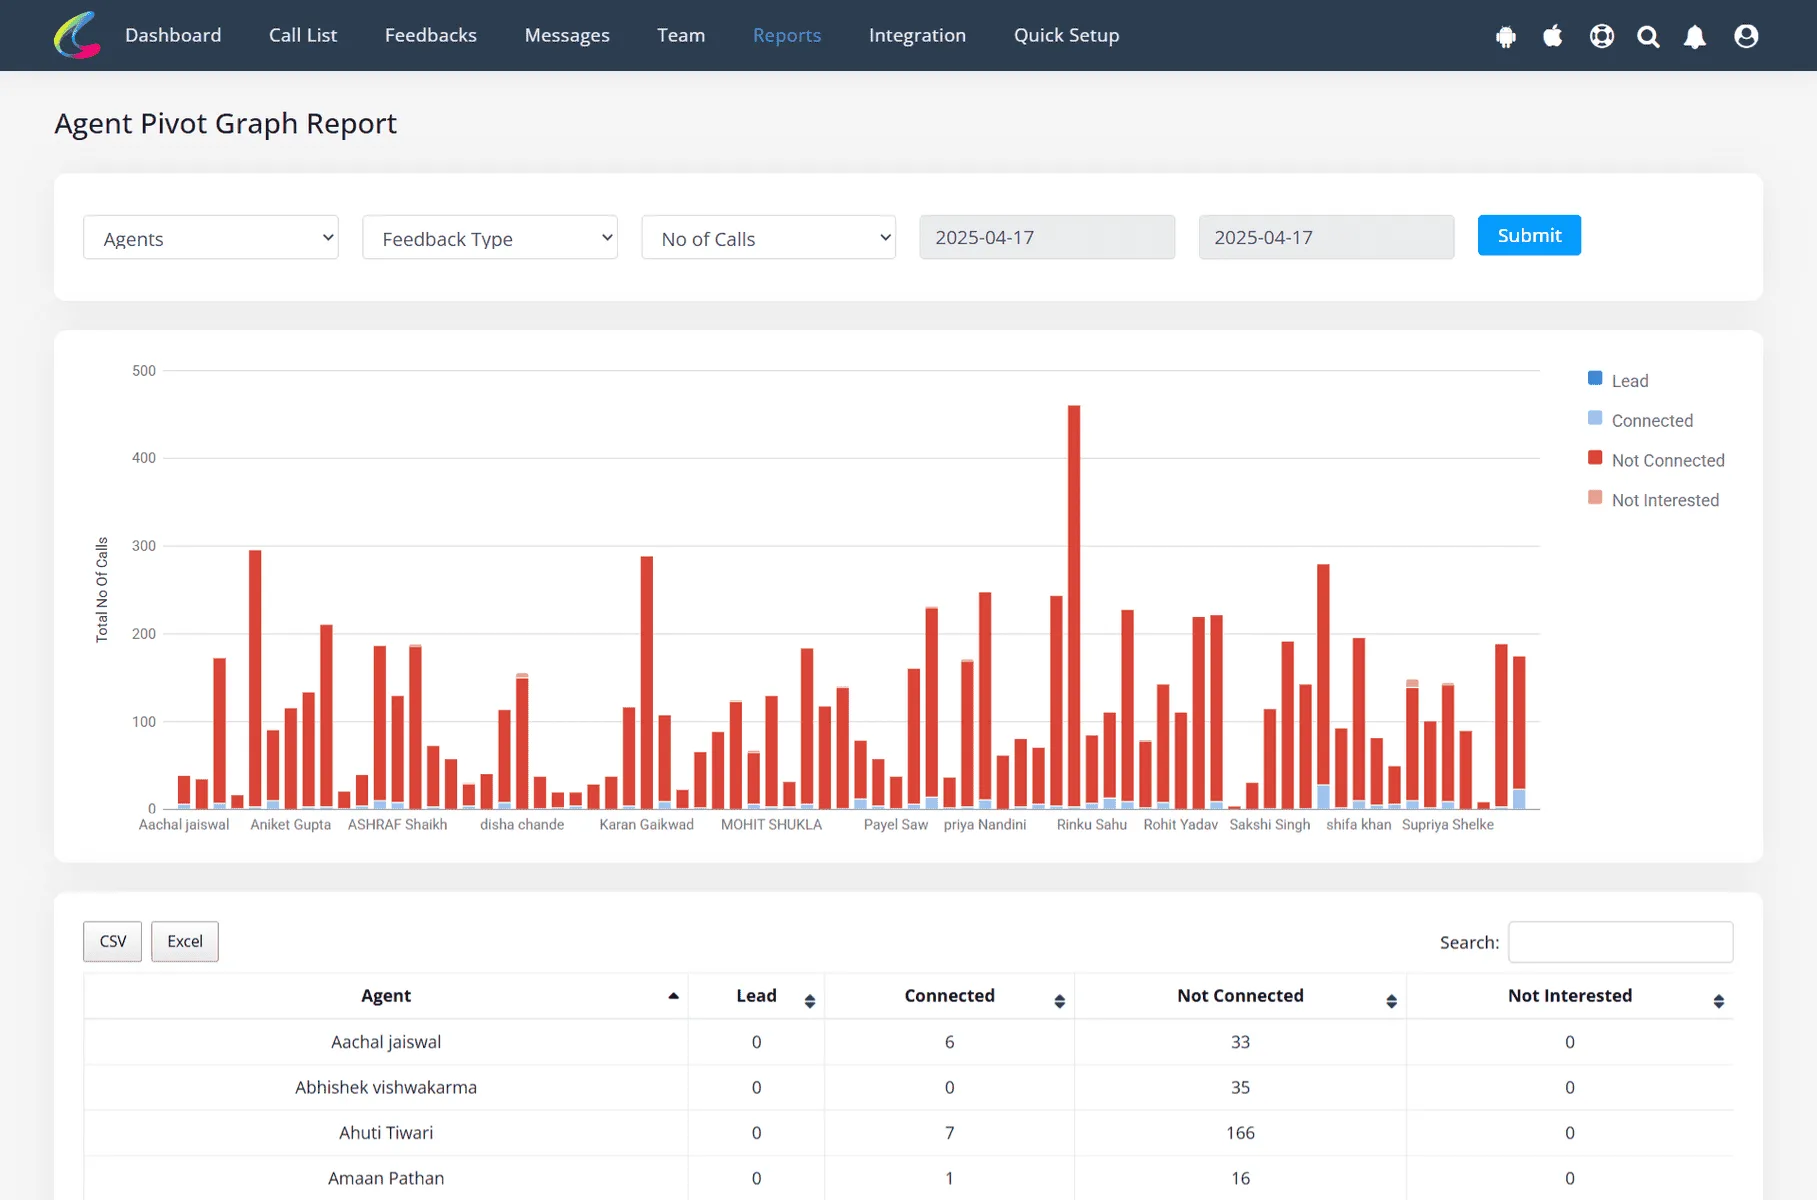
- ✓Agent Pivot Graph Report – Gives a detailed, side-by-side comparison of agents based on feedback categories like Lead, Connected, Not Connected, and Not Interested.
These visual tools help managers and team leads evaluate productivity, identify trends, and make informed decisions to optimize calling strategies.
How It Analyzes Team Performance
- ✓View agent-wise distribution of call statuses such as Connected, Not Connected, Skipped, and Not Interested
- ✓Understand total talk time and call count per agent
- ✓Track which feedback types are most associated with each team member
- ✓Drill down by date range, list, and feedback type
- ✓Compare agent outputs to identify high and low performers
Why This Helps Your Business
Track Agent Productivity – Visualize call activity and talk duration across your team.
Compare Feedback Patterns – See which agents generate the most interest and which struggle with engagement.
Targeted Coaching – Identify agents who may need support or training based on actual performance metrics.
Downloadable Reports – Export graphs and tables in Excel or CSV for deeper analysis and reporting.
How to Access This Report:
- ✓Navigate to the “Reports” section in the top menu.
- ✓Select “Agent Performance Report” to view the performance graph.
- ✓Use the filter options (Date Range, Agent, Feedback Type, etc.) to narrow down the data.
- ✓To view the pivot comparison, go to “Agent Pivot Graph Report” from the same Reports section.
Agent Performance Report:
Agent Pivot Graph Report:
The Call Analyses Graph in Calley empowers businesses to turn every call into a strategic opportunity. Whether you’re refining your outreach, evaluating agent performance, or tracking lead engagement — these visual tools provide the clarity you need to act fast and improve continuously. From solo professionals to large sales teams, Calley’s reporting helps everyone sell smarter.
Checkout here > Pricing Plans for Calley Auto Dialer App
Link to > Full Feature List of Calley AutoDialer
Do you want to Subscribe to a Free Auto Dialer with a limit of 25 calls per day?
We know you will have questions.
We would love to answer all your questions to get you started with Autodialing using The Calley Auto Dialer app.